Editor's note: The following post is by Herb Bassett, a teacher who has a commanding understanding of the complex school rating and grading systems imposed upon our schools by the Louisiana Department of Education. His analysis of the latest school rating system to be released by the LDOE on November 6 should be very helpful to parents and teachers in avoiding false conclusions about their schools. It points out serious flaws in the rating system that produces high and low scores often in an arbitrary manner.
Over the last six years, Bassett has documented the effects of changes to the methods of computing Louisiana's school performance scores and commented on the use of growth measures in school and principal evaluations. (Links to SPS articles: 2012,2013 predictions, 2013,2016 history) This analysis reviews the latest changes in the school rating system.
Over the last six years, Bassett has documented the effects of changes to the methods of computing Louisiana's school performance scores and commented on the use of growth measures in school and principal evaluations. (Links to SPS articles: 2012,2013 predictions, 2013,2016 history) This analysis reviews the latest changes in the school rating system.
Interpreting Louisiana's Growth Scores for Schools:
by Herb Bassett, Grayson, LA
hbassett71435@gmail.com
Growth scores will be a new feature of Louisiana's school performance evaluations this fall. In the past, the Louisiana Department of Education (LDOE) graded schools primarily on how many students had reached the levels of basic, mastery, and advanced. Schools whose students arrived at their doorsteps as high achievers were more likely to receive higher letter grades than schools who started with struggling students. In some schools, many students started far behind but made remarkable gains; however the schools were penalized because the students did not progress all the way to the higher achievement levels in a single year. Growth scores are an attempt to reward and recognize schools whose students make outstanding improvements regardless of the achievement level they attain.
Growth measures are simple in concept, but they are difficult to implement. In 2013, LDOE introduced a growth measure into its school accountability system. Called Bonus Points, they applied only to students scoring below basic. The initial implementation of the Bonus Points was problematic. Some schools that year were penalized because they moved too many students from below basic to basic. Had those students scored lower on the tests, those schools would have received a higher letter grade. LDOE later modified the rules to address that problem.
We now have a preliminary indication that the new growth scores will also present problems.
LDOE released"Top Growth" rates in late August. While they are not the final growth scores, they indicate how many students earned an "A"-level of points for their schools. Students qualified either by being in the top 40 percent of a value-added-model (VAM) ranking[i]or by meeting a "growth-to-mastery/advanced" (GTM) target. Since the top 40 percent of the VAM ranking qualify, it guarantees that the statewide "Top Growth" rate will be at least 40 percent. While many students qualified by both measures, a significant number qualified strictly through GTM. Any "Top Growth" rate over 40 percent can be attributed solely to GTM.
Since the "Top Growth" rates indicate that GTM will introduce substantial biases, I offer the following advise to parents, educators and legislators to help them interpret the new growth scores.
1) You should not compare junior high schools and high schools to elementary schools.If you have children in both elementary and junior high schools, do not be alarmed if the junior high has a lower growth score than the elementary. This does not necessarily mean that the junior high is not helping students improve. GTM gives elementary schools a significant advantage over junior high schools and high schools.
A student's year-end GTM target is the number of points the student was below Mastery in the prior year divided by the years remaining to the end of the eighth grade. An eighth grader has only one year to the end of the eighth grade; a fourth grader has five years. Given the same baseline score, GTM requires an eighth grader to improve five times as much as a fourth grader to meet the target. [ii]
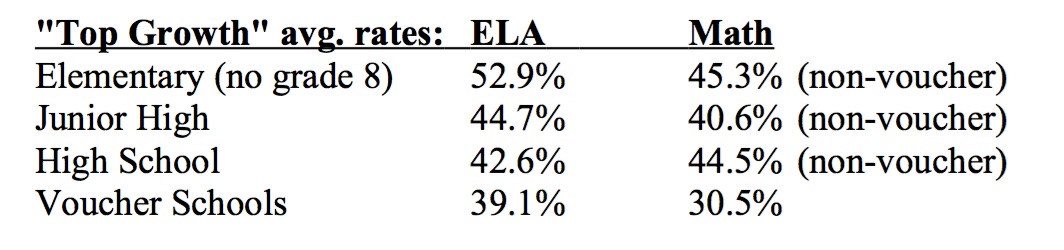
This puts junior high schools at a clear disadvantage and explains why elementary schools have significantly higher "Top Growth" rates[iii]:
"Top Growth" avg. rates: ELA Math
Elementary (no grade 8) 52.9% 45.3%
Junior High 44.7% 40.6%
2) You should not compare the growth scores of schools with many high-achievers to those with many low-achievers. If your child's school was an "A" school last year, do not be alarmed if the new growth score is not an "A". "A" and "B" schools have many students already at Mastery or above; GTM targets require them to make roughly twice as much improvement as lower achievers.
The minimum score for Basic is only 25 points below Mastery; to reach Mastery from Basic, the most a student has to improve is 25 points by the end of the eighth grade. Students already at Mastery have to reach Advanced to earn points through GTM. A student at low Mastery has to progress about 50 points to reach Advanced by the end of the eighth grade.[iv]
Compared to schools with lower letter grades, "A" and "B" schools have many more students starting from Mastery or higher; such students were only half as likelyto earn "Top Growth" status solely through GTM as those who scored Basic in the prior year.[v](However, LDOE will partially compensate for this bias through its final scoring method.[vi])
3) Growth measures are unstable, and GTM yields erratic results dependent on the style of student growth.Your child's school's growth score will contain a lot of statistical noise.
LDOE will base its scores on growth data from two years rather than a single year. This will mitigate some year-to-year swings, but will also create winners and losers among schools based on how and when in the two-year cycle that students show growth.
Slow and steady wins the race, even when students finish behind. GTM penalizes schools if students reach Mastery too soon. A student who crosses the threshold for Mastery in the first year is then assigned a much more ambitious target for the second year. If a student gets close to Mastery without going over, he is given an easier-to-meet target. Slow, but steady growth earns more points than growth in spurts, even when the two-year total of growth is greater through a spurt. In this way, schools may be rewarded for holding students below Mastery until they reach the highest grade in the school.
The table below shows the uneven scoring of different growth styles; Bobby had the least growth over two years but earned the most points:
The LEAP 2025 score range is 650-850; minimum scores for: Mastery - 750; Advanced (eighth grade) Math - 801, ELA 794. LDOE awards 150 points for meeting a GTM target. If the target is not met, points are awarded based on the VAM ranking. 150 points for the top 20 percent, 115 points for the next 20 percent, then 85, 25, and 0 for the next 20 percent cuts.
There is a corresponding but opposite effect for students who decline over two years. A student who declines slowly but steadily can earn fewer points than one who drops precipitously then rebounds, even if the total decline of the latter is greater.
Some elementary/junior high school pairs will be impacted. If student achievement spikes in the highest grade of an elementary school, the junior high the next year is disadvantaged; especially so if the elementary spikes the rate of students at Mastery. In junior high they would then receive harder-to-reach targets based on reaching Advanced.
Further study is needed to quantify this effect. I have found several examples of extreme swings in growth measures from feeder school to receiving school, but I do not have enough data to determine if the examples are part of a clear trend.
4) Public schools significantly outscored voucher schools in "Top Growth".If students are to be given school choices, then growth measures provide the most relevant information about which schools are the most effective, especially for struggling students. In the past, school letter grades essentially indicated how likely it was that the student in the next seat scored Mastery. It would be better to know the likelihood of a student in the school making significant improvement. That is what growth scores are meant to tell us.
The "Top Growth" rates indicate that voucher schools overall made significantly less progress with students than the average public school.[viii]

While GTM introduces biases into the growth scores, the biases do not account for the lower overall "Top Growth" rates of voucher schools. Indeed, if voucher schools attract struggling students, the growth scores should be biased in their favor as described in the second point above. Since the rates are below 40%, they indicate that voucher schools must perform poorly on the VAM measure as well.
Thus, the data contra-indicate the state policy of awarding vouchers to students to leave public schools for voucher schools. In voucher schools overall, students are less likely to make substantial gains.
5) Finally, read any LDOE claims about growth with a critical eye.Because letter grades are tied to school choice options, LDOE sometimes spins data to support the policy of allowing students in "C", "D", or "F" schools to switch to "A" or "B" schools. If school choices are really about optimizing student growth, "A" and "B" schools are not necessarily the best choices. Read correctly, the existing growth measures indicate that "D" schools overall produce more student growth. However, in the recent past, LDOE has sorted data so as to skew the "A" schools' average growth measures upward and the "F" schools' average growth measures downward.
From one year to the next, schools with high growth may move up a letter grade; those with low growth may drop a letter. When averaging "A" schools' growth, LDOE has taken out schools that started the year as "A" schools if they dropped to a "B" at the end of the year. However, schools that had high growth and rose from a "B" to an "A" by the end of the year were put into the average. By systematically including high growth and excluding low growth from the average, the growth average for "A" schools was exaggeratedly high.
For "F" schools the effect was the opposite. High growth schools that moved up to a "D" over the course of the year were excluded from the average while low growth schools that dropped to an "F" were included. This depressed the average to an exaggerated low.
It is important to note that parents make school choices based on a school's prior-year letter grade, not the one it will get at the end of the year. The data should reflect that reality.

I urge you to bear in mind the biases described above when considering the new growth scores. For any given school, the growth scores are expected to vary more from year-to-year than the proficiency rates which have been the basis of school letter grades for many years now. Prudence dictates adopting a wait-and-see attitude before making significant course changes in response to these new and problematic measures.
[i] VAM is an elaborate statistical process that competitively ranks students. It considers student characteristics beyond mere test scores. Now, in any ranking, there will be a top 40 percent, so VAM guaranteed a "Top Growth" rate for the state of 40 percent. However, some students qualified for "Top Growth" solely through GTM. The amount above 40 percent can be attributed solely to GTM.
[ii] Students who scored mastery or advanced in the prior year receive similar targets with a goal of reaching advanced. For high schools students in grade nine and ten, targets are set based on reaching the goals by the tenth grade.
[iii] . LDOE classifies schools as Elementary (only grades K-8), High School (only grades 9-12), and Combination schools (schools with at least one K-8 grade and one 9-12 grade. By cross-referencing LDOE classifications with multi-stats files from LDOE, it is possible to establish what grade levels a school contains. Here, I define a junior high school as an elementary school that contains grade 8 but no grade lower than 5. Combination schools and elementary schools that contain all grades 4-8 were excluded.
[iv] The level for advanced is approximately 800, but varies from test to test. On the current LEAP 2025, the level for advanced in the eighth grade is 801 in Math and 794 in ELA.
[v] https://www.louisianabelieves.com/docs/default-source/test-results/2018-leap-2025-student-progress-media-briefing.pdf?sfvrsn=6. Slide 11 of the presentation. The amount above 40% cam be attributed solely to growth-to-mastery.


[vi] For the growth score system, LDOE will award any student ending the year at Mastery a minimum of 85 points out of a possible 150 even if the VAM ranking would have only awarded zero points.
[vii]About eight percent of students who would have scored 85 points or less from the VAM rankings will earn 150 points through GTMSee this Accountability Commission presentation from January 2017slide 40.
[viii] I identified these schools as scholarship program (voucher) schools in the "Top Growth" file and excluded those with NR data:


